# Foreword
This is a long-winded post and is full of a bunch of data I assimilated from sources when I was bored. This post is not to pitch my opinion or to convince anybody. It is simply a data dump of information publicly available to stimulate conversation and contribute to the community. I am not attempting to peddle my opinion regardless of the data. I collected it to simply gauge what it says.
​
This is a two-part post I put into one. This first segment is rather shoddy as I wrote it up in about 25 minutes during the absolute shellacking we took this week against Illinois. If you want to skip the first section I don’t blame you. It’s haphazardly put together. I will post a TL;DR at the bottom of each section.
​
# Part 1: When Do Universities Dump Coaches?
​
I will commence my data-dump of seemingly useless information regarding an assortment of teams and when they fire coaches. I started this endeavor once the “Fire Scott Frost” train started picking up some localized steam in the Nebraska fanbase.
​
Before we begin let me set the criteria for my selection of teams. I am taking a look at an assortment of 30 teams across the varied power landscape that is CFB. I have three groups:
​
The Greats:
​
|Teams:|Winning Percentage|
|:-|:-|
|Ohio State|.730|
|Notre Dame|.729|
|Michigan|.728|
|Alabama|.728|
|Oklahoma|.725|
|Texas|.704|
|USC|.699|
|Nebraska|.689|
|Penn State|.687|
|Tennessee|.673|
​
Average Joes:
​
|Team:|Winning Percentage|
|:-|:-|
|North Carolina|.559|
|Navy|.555|
|California|.551|
|Missouri|.545|
|Ole Miss|.545|
|Iowa|.540|
|TCU|.539|
|Oklahoma State|.520|
|Virginia|.520|
​
​
Bottom-Dwellers:
|Team:|Winning Percentage:|
|:-|:-|
|Mississippi State|.492|
|Vanderbilt|.490|
|Kansas|.472|
|Oregon State|.471|
|Iowa State|.455|
|Kansas State|.455|
|Northwestern|.452|
|Tulane|.452|
|Indiana|.423|
|Wake Forest|.415|
​
​
How these teams were chosen: I wanted an array of teams that covered the elite, the middle-class, and those that just are not very good. We have 10 teams per category. The entire collection of teams across CFB were sorted based on their overall winning percentage as seen on [Winsipedia](http://www.winsipedia.com/ranking/all-time-record). Before I sorted the teams I had already thought to myself I didn’t want to use teams like App State, Boise State, Coastal Carolina, et al, that have few wins at the Division 1-FBS level. I decided to add up all teams’ total amount of games played and found the median: 1163. For a team to be selected they must have a greater than or equal amount of wins to this number. After that, I simply selected the top-10 teams for the first group. The second group was selected as the middle-ground number of 65, which was Ole Miss. They are the 65th highest winning percentage team in CFB out of 131 teams. I used them as the center and selected an even amount of teams above them and below them that also had a greater than or equal amount of games played as compared to the median figure of 1163. Next, we go to the bottom of the list and work our way up. We get rid of teams like Charlotte, Georgia State, Kent State, et al, who have not played the required total of 1163 games.
​
*^(A quick note: There are several teams I could have included that were almost at the 1163 mark, or within a handful but I chose not to. Why? Just because. No rhyme or reason really. As an example: Rice has 1135 wins and could have been included in the Bottom-Dwellers but I decided to stick with a requirement of ‘more’ than the median for a larger game n= sample.)*
​
I also had to deal with the fact that season length is not the same for every year. How do you value a year in 1910 when a team may have only played 8 games, but in 2010 they may have played 12? My shoddy solution: judge coaches based on total games and then simply define a “year” as 12 games. The problem with this is the fact the “years of good coaching” may not actually line up with the total amount of years said “good coaching” may have actually been with the team. It still however matches the total amount of games if you simply multiple the “year” value by 12. Bottom line: A “year” is 12 games. Enough said about that.
​
Next, we have to determine what “good” and “bad” are. I once again went back to Winsipedia and sorted the teams once by [winning percentage](http://www.winsipedia.com/ranking/all-time-record) and picked the top-25 as my barometer. If a team is inside the top-25 we usually consider them to be “good”, yes? So why not here. Thanks, Texas A&M, for setting our “good” baseline. If a team has a winning percentage equal to or higher than Texas A&M’s (.604) we will consider them to be good.
​
*^(A quick note: I lowered the bar to .600 instead of their actual .604 mark. Why? Because the team below them is at .599 and .600 makes my brain happy. Don’t judge me.)*
​
To be an average team they must be above .500, but below .600. To be bad the team must be below .500 with no floor. This gives us the three groupings of:
​
​
|Good|>= .600|
|:-|:-|
|Average|>= .500 & < .600|
|Bad|< .500|
​
With the pageantries out of the way let’s get to the data. What does it tell us? Absolutely nothing we could not have already figured out with 5 seconds of critical thinking.
​
The short and skinny: Good teams hire good coaches and minimize years with bad coaches. Average teams are average in terms of having good/average/bad coaches. They tend to hold onto “bad” coaches longer, however. Bad teams: Bad. They tend to hold onto bad coaches the longest and have good coaches for fewer amount of years due to varying reasons.
*^(Quick Note: This does not differentiate between firings, retirements, poached coaches, or other varying reasons a coach and school may part ways. This includes any and all forms of parting.)*
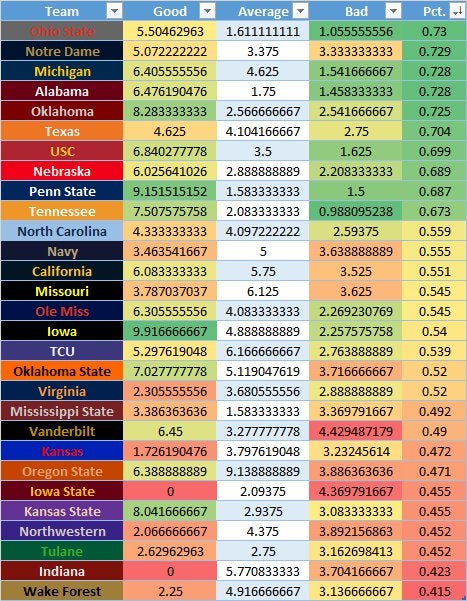
# [Here’s the data!](https://imgur.com/a/g40ZqKg)
​
The teams are sorted by overall winning percentage to give us a quick look at overall power. We can immediately notice that there is only **one** team that is in the “elite” category of winning percentage (>.600) that has historically held onto **bad** coaching for more than 3 years and that would be Notre Dame. With that one exception noted, there is not a single elite-level team that would hold onto a coach with a below .500 record for 3 years or longer. In short: **Good** teams do not put up with **bad** coaching and that is the reason they are historically good.
​
On the opposite end of the spectrum, we see the inverse is true. **Bad** teams almost exclusively hold onto **bad** coaches for 3 years at a *minimum*. They “ride or die” with their coaches and thus it costs them more wins over a longer period of time. Hence, an overall worse winning percentage due to having worse coaches for longer. *Who would of thunk it?*
​
**WAIT A MINUTE!** This is taking into account the early 1900s where the game had completely different rules! Coaching was sometimes done by player-coaches, and it wasn’t taken as seriously as it was now! This is bad data!
​
…..you got me. You are right. Let’s then look at only the “modern era’ of college football and see how that changes the data. To do so, we must first define what the modern era is. The general consensus is that it’s undoubtedly after WWII, and most say at around the late ’70s, or early ’80s. This is when the transition to scholarship limits and the transition to Div 1 and Div 2 (FBS/FCS) took place. Combine this with the fact that television rights took off in the ’80s and programs started to actually take the game seriously points to a common answer being the year of 1982 to be the unofficial “Modern Era of College Football”. With this in mind, we must account for coaches who coached both during the year 1982, after, and of course, before. I haphazardly decided to let the entire coach’s tenure count as long as they coached **during** the 1982 season. This means coaches like Bear Bryant of Alabama get their *entire* tenure counted even though his last year was…1982. This happens a few times and it does alter the data *slightly* but not enough for me to change the implementation. So here is the data if we are only counting coaches who coached during the modern era of college football (and all their games prior) in the years 1982 and after!
​
# [The Modern Era Version](https://imgur.com/a/238Na7c)
​
*^(Quick Note: This version is sorted by bad years instead of winning percentage.)*
​
How does this change our perspective of the data? It really doesn’t. We can still see the teams who have never had a **good** coach are near the bottom right where we expected them to be. Teams at the top who have never had **bad** coaches are also expected like Alabama, Notre Dame, USC, and even Penn State who had Penn State for an eon; instances like Paterno are also seen at Iowa who is seemingly the “top team” at retaining elite level coaching. In reality, it’s because their number of coaches is a grand total of 2 since 1982. Fry followed by Ferentz. No one else. That’s it. However, the previous data statements still hold true: **Good** teams have **good** for longer while minimizing time with **average** or **bad** coaches.
​
Overall what this data really tells me is that teams must not hire **bad** coaches; and if they do, do not hold onto them for more than about 3 years. Once again, not a single team with a winning percentage above .600 is seen having a **bad** coach for much longer than 3 years. This also shows us that parting ways with a coach after 3-4 years is not as uncommon as many fans think it is. I see a lot of speak about “give them time” but in reality that isn’t what is done. The teams who hold onto their bad coaching for longer are statistically at the bottom of every list I find. While it begins with hiring good coaches in the first place, it also transitions into minimizing time with the worst.
​
You can see additional data from [BannerSociety](https://www.bannersociety.com/2020/2/20/21145985/college-football-coaches-average-years) that also shows coaches stay 3.9 years on average (Data: 2005-2014). [Saturday Down South](https://www.saturdaydownsouth.com/sec-football/average-sec-head-coaching-tenure/) collected data on SEC coaches since the start of their programs and you can once again see the most dominant conference in college football has had coaches for…~4 years on average.
​
What really matters is hiring the right coach. I am currently putting together an actual analysis that isn’t shoddily put together in 25 minutes about the top tier coaches and how we identify them. Stay turn for that either later tonight, or tomorrow (hopefully).
# TL;DR Teams will dump coaches roughly every 4 years. Good teams hold onto good coaches, bad teams hold onto bad coaches. Moral of the story: Hire a good coach to begin with.
​
# Part 2: How Quickly Does A Coach Turn A Program Around?
This post is an actual review of coaching talent and how we can identify it, if at all. It is an addendum to my previous post about how long coaches are at their universities. Once again, we will be looking only at coaches in the “modern era” which we previously defined as 1982; however, we will only be viewing seasons from 1982 and not the coaches’ previous seasons like we did last time.
​
# The Set Up:
[Here is a list](https://imgur.com/a/fQN6WyW) of all coaches and their overall winning records for all Division 1 FBS teams since the 1982 season. If this information is inaccurate I apologize. My source for this data is the absolutely **fantastic** CollegeFootballData API [located here](https://api.collegefootballdata.com/api/docs/?url=/api-docs.json). If you have never used that API I highly recommend it, although it is not perfectly accurate at all times.
​
*^(Quick Note: This list is sorted by overall winning percentage. We can effectively ignore the individuals at the top of the list who have never coached a game, or have only coached a few and won them. The green “YES” next to their name indicates whether they have coached for)* *^(at least)* *^(48 games or 4 years’ worth. With this in mind, we can notice the greatest coach in terms of overall winning percentage that has coached for at least 4 years is….Coach Tom Osborne of Nebraska fame.)*
​
Next, we want to determine which coaches we’re going to take an in-depth review of. We’ll eliminate coaches like Day of Ohio State, Drinkwitz of App. State/Missouri, Riley of Oklahoma, et al because they simply do not have a large dataset to go off of. We’re going to be looking at those coaches with a high overall winning percentage and we’ll look at some of the top coaches since 1982, some middling coaches, and a few…not so good ones.
​
# The Metrics:
We will compare the coaches to their predecessors and determine whether the **increased, decreased, or maintained** the status quo of their programs during their runs. We will also keep a note of how *quickly* we can objectively say they were improving. In other words, how many years until we saw the win total go up!
​
Up to bat first is good ‘ol Urban Meyer! Come on down!
​
# [URBAN “HEART ACHE” MEYER](https://en.wikipedia.org/wiki/Urban_Meyer)
Mr. Meyer got his first start as a head coach with the Bowling Green Falcons. Bowling Green has a total winning percentage of [.572](http://www.winsipedia.com/bowling-green) including Meyer’s time. Urban took over the head coaching vacancy in 2001 following the work done by [Gary Blackney](https://en.wikipedia.org/wiki/Gary_Blackney) who coached with them from ’91-’00. Blackney is an interesting starting point because he took over for [Moe Ankney](https://en.wikipedia.org/wiki/Moe_Ankney). Mr. Moe had a winning percentage (hereby noted as WP) of .398. Blackney immediately improved upon that by winning 11 and then 10 games in his first two seasons. However, he would finish with a WP of .544. A decent clip, but below Bowling Green’s historical figure and far from elite. His hot start would end in shame and he would ultimately quit his duties. Meyer enters for two years and accomplishes 8 and 9 wins for a WP of .739. While not as elite as Blackney’s start, it is still really good considering where Blackney left the program and was in an immediate improvement. Winning as many games in just two years as Blackney accomplished in the previous 4 and a half years. This qualifies as an immediate improvement and it did not even take a transition period.
The Fighting Bowling Green Meyers:
Transition: None
Improvement: Yes
Length: 2 Years
WP: .739
Continued: No
Meyer’s success would be noted by Utah where he would move on to be the new head coach. Meyer is replacing [Ron McBride](https://en.wikipedia.org/wiki/Ron_McBride) who coach at Utah for 13 years with a WP of .582. Utah has a historical WP [of .593](http://www.winsipedia.com/utah) so McBride’s figure is nothing to write home about. Meyer enters and immediately wins 10 and then 12 games in his two years at Utah for a WP of .917. Once again, Meyer strikes.
The Raging Utah Meyers
Transition: None
Improvement: Yes
Length: 2 Years
WP: .917
Continued: No
^(Note: Meyer’s successes at BGSU and Utah were not followed up with success by his successors. The drop was instant and noticeable once he left. This gives credence to the fact that Meyer was responsible.)
Meyer is finally on the big-boy radar and gets picked up by Florida. The year is 2002 and Florida is coming off a coaching high that was Spurrier. Stevie posted a WP of .817 and a national championship. He is followed by Ron Zook and his .605 WP. While not terrible, it is an extreme reduction in what UF is used to, so after 3 years he is replaced by Meyer. In his first year, Meyer wins 9 games which are more than Zook managed in his 3-year stint. Meyer follows this up with a national championship in year 2 and finishes his heart-filled career at Florida with two national titles and a WP of .850. This figure is an immediate and drastic improvement upon both Zook and the legendary Spurrier. Also noted is the fact that Florida’s [historical WP is .633](http://www.winsipedia.com/florida). Meyer would be followed by Will Muschamp who posts a WP of .580 while at Florida. This means his success was his own and not continued by his successor.
Hearty Florida Meyer’s
Transition: 1 year
Improvement: Yes
Length: 6 Years
WP: .850
Continued: No
​
Meyer isn’t done yet.. He takes a gap year and then returns to coaching with Ohio State following in the footsteps of [Jim Tressel](https://en.wikipedia.org/wiki/Jim_Tressel). Tressel posted a [WP of .828](https://en.wikipedia.org/wiki/List_of_Ohio_State_Buckeyes_football_seasons) and is above their [historical WP of .730](http://www.winsipedia.com/ohio-state). (Counting vacated wins). Urban boat races his competition and goes undefeated in his first year and never loses more than 2 games in his 7 year OSU career. He finishes with a WP of .905. An improvement on both Tressel, and the interim Luke Fickell and is well above the OSU historical WP.
Poisonous Ohio State Meyer’s
Transition: None
Improvement: Yes
Length: 7 years
WP: .905
Continued: TBD (Only 1-year post-Meyer)
We can plainly see Meyer is elite. No one is really questioning that. However, it does set up a sort of upper limit of achievements. Meyer has turned around every program he has ever been to and done so immediately, or with very little amounts of transition years. Meyer shows that elite coaches will immediately improve a team and start to win games.
—
# Additional Elite Coaches
To save you the boredom of having to listen to my spiel about every single coach (as well as save me time) I will now do the same for some more top-tier coaches but only with the metrics we listed. Here they are:
​
​
|Coach|Team|Improvement|Transition Years|Tenure|WP|Continued|
|:-|:-|:-|:-|:-|:-|:-|
|Pete Carroll|USC|Yes|1|9|.789|No|
|Jim Tressel|Ohio State|Yes|1|10|.828|Yes*^(1)*|
|Gene Stallings|Alabama|Yes|1|7|.810|Push|
|Dabo Swinney|Clemson|Yes|3|13+|.811|-|
|Bob Stoops|Oklahoma|Yes|1|18|.798|Yes|
|Chris Petersen|Boise State|Push|0|8|.885|Yes|
|Nick Saban|Alabama|Yes|1|14+|.874|-|
|Kirby Smart|Georgia|Slight|1|5+|.774|-|
|Bob Pruett|Marshall|Yes|0|9|.803|No|
|Jimmy Johnson|Miami|Yes|1|5|.852|Yes|
|Bryan Harsin|Boise State|Push|0|7+|.788|-|
|Gary Moeller|Michigan|No|-|5|.733|-|
|Jimbo Fisher|Florida State|Yes|0|8|.783|No|
|LLoyd Carr|Michigan|Slight|2|13|.753|No|
|Vince Dooley|Georgia|Yes|2|25|.715|No|
*^(1 – There was continued success after Luke Fickell’s interim year)*
What does this tell us? These are the top-16 coaches in college football history by WP (not including coaches prior to the 1982 season). Every single one of these coaches took 3 transition years or fewer to turn their programs around completely, increase their status, or maintain the status quo. Only one coach, Moeller, is someone I’d consider to not have “improved” his team’s situation. Smart and Carr slightly improved their already good teams. Petersen and Harsin of Boise State I don’t believe really improved their programs – they were already good and remained good. Half of the coaches left the program and they got worse immediately following. Short point: Elite coaches do not need more than a few years to show you why they are elite. The turn-around will be near immediate and it will be grand as all these coaches have a WP of .715 or higher with their respective programs. All these coaches also have a career WP of .750 or higher.
​
# Mid-Tier Coaches
​
How about non-elite coaches? Let’s take a look at some above-average, or average coaches and see how they fare.
​
​
|Coach|Team|Improvement|Transition Years|Tenure|WP|Continued|
|:-|:-|:-|:-|:-|:-|:-|
|Bo Pelini|Nebraska|Yes|0|8|.713|No|
|Tom Herman|Texas|Yes|1|3+|.625|-|
|Les Miles|LSU|No|-|12|.770|-|
|Paul Chryst|Wisconsin|Yes|0|5+|.761|-|
|Mike Gundy|Oklahoma State|Yes|3|15+|.673|-|
|Bill Snyder|Kansas State|Yes|1|27|.647|No / Push^(2)|
|Mark Dantonio|Michigan State|Yes|0|13|.667|N/A*^(3)*|
|Dan Mullen|Mississippi State|Yes|1|8|.600|No|
|Dan Mullen|Florida|Yes|0|2+|.818|-|
|Ken Niumatalolo|Navy|Slight|0|14+|.612|-|
|Luke Fickell|Cincinnati|Yes|1|3+|.723|-|
|Matt Campbell|Iowa State|Yes|1|4+|.543|-|
|Matt Campbell|Toledo|Yes|0|3|.700|No|
|Art Briles|Houston|Yes|1.5|5|.548|Yes|
|Art Briles|Baylor|Yes|2|8|.637|N/A*^(4)*|
|Jeff Brohm|Purdue|Yes|0|3+|.452|-|
|Jeff Brohm|Western Kentucky|Yes|1|3|.750|No|
|Paul Johnson|Georgia Southern|Yes|0|5|.861|No|
|Paul Johnson|Navy|Yes|1|6|.608|Push|
|Paul Johnson|Georgia Tech|Yes|0-1*^(5)*|11|.573|No|
|Scott Frost|Nebraska|No|-|3+|.375|-|
|Scott Frost|UCF|No*^(6)*|1|2|.684|Yes|
*^(2 – Snyder had two separate stints at Kansas State. Opinions for 1st and 2nd stint listed.)*
*^(3 – Dantonio and Michigan State only separated ways in 2019.)*
*^(4 – Art Briles scandal at Baylor. An odd situation to judge; however, I’d say no. It was reinvented by Rhule.)*
*^(5 – Subjective. I do believe he transitioned smoothly without a gap year.)*
*^(6 – Subjective. UCF had a coach retire mid-season and they went 0-12 to make the turn-around look more impressive.)*
So it seems the truth is still the same for mid-tier coaches. If they will turn around teams then they will do so within 2-3 years. None of the coaches I selected took more than 3 years to turn their programs around. These coaches were chosen at random going down my list. There was no rhyme or reason to choosing their names outside of a few selects being chosen simply based on name popularity.
If we combine this information with the information we already know being that teams part ways with their coaches on average every 4 years or so it makes sense; because teams will see improvement or not within those 4 years and be able to decide if a coach is worth keeping or ditching.
​
# TL;DR It takes 3 years or less (usually less) to turn a program around. If success is not seen within 3 years it usually will not happen. There are of course outliers but I found NONE in the random couple dozen coaches I chose to look at.
—
This post is NOT to call for a firing of Head Coach Scott Frost. It is simply a data-dump of my boring weekend to stimulate conversation in this sub. I do have an opinion on whether Frost is the answer but this information was simply gathered to see what it showed – not to prove a point. If there are any data errors please let me know. There probably is as both the API I use to scrape information from is sometimes inaccurate and I am only one man and make errors. I also know there are already some errors, especially in the coaching section as the API did NOT pull all head coaches in the early years. Alas, I didn’t fix it as the resulting data change was negligible for a simple Reddit post.
​
—
​
If you would like to analyze the data yourself I have uploaded both the historical and 1982+ versions to Google Drive for your viewing and analysis. [They are available here.](https://drive.google.com/drive/folders/1xoV9S2UoqRimt-rI5jXmSU7diDdXJszt?usp=sharing) You are free to download, utilize, and change it. Keep in mind these were made using Microsoft Excel and use formulas and interactions specific to Excel and it will more than likely NOT look accurate in Google Sheets. Specifically nestled functions such as the VLookup nestled Matrix function I used for the coaching section. You have been advised.


You must be logged in to post a comment Login